Shear Storage Modulus Compilation Graph
04/30/20
The stiffness of the substrate surrounding cells affects substrate stiffness affects propagation, gene expression, morphology, pluripotency, migration, differentiation, lineage specification.
At Advanced BioMatrix, we strive to provide our customers with as much data and quantitative information as possible to enhance your research.
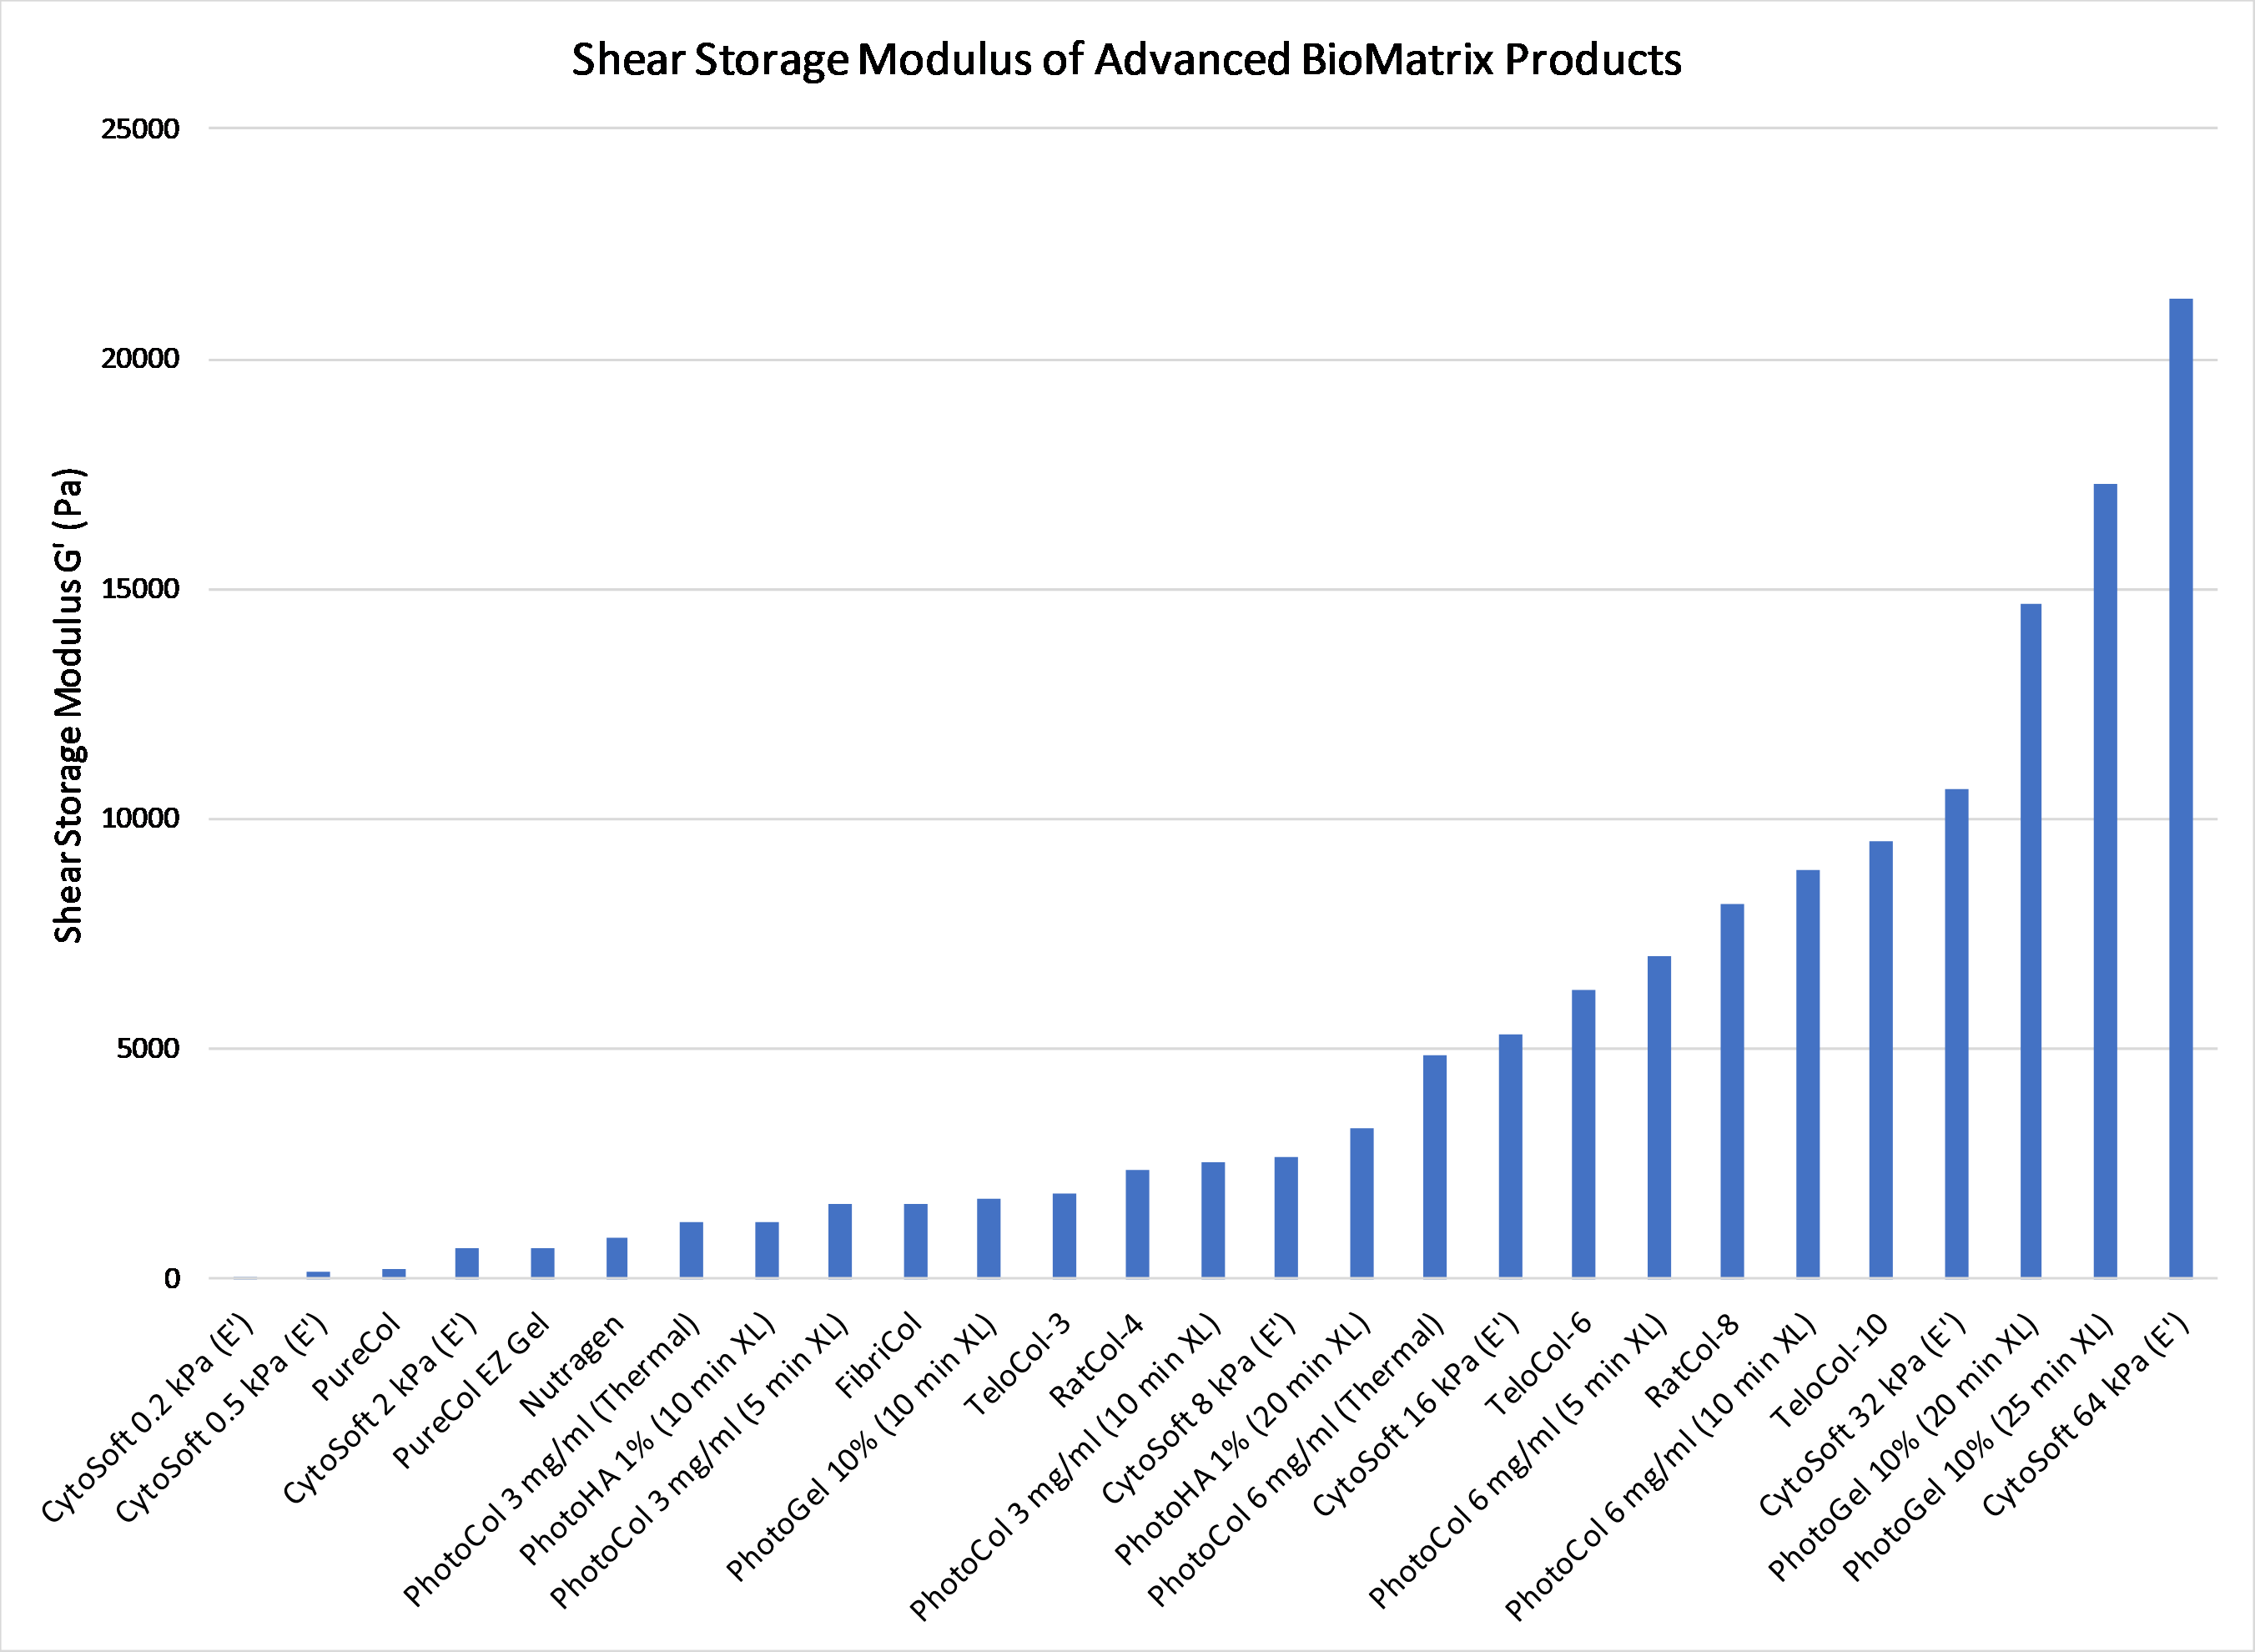
We took all relative products and measured the 3D hydrogel shear storage modulus. The graph below indicates that we have products that can cover essentially the entire physiologically relevant range of tissue stiffness. This is important because it allows you to truly replicate in vivo environments in your cell culture and tissue engineering studies.
Key:
CytoSoft® plates are measured on a separate rheometer, and the data is obtained in E'. To convert those values to G', we divided the respective values by 3 according to an estimated poisson's ratio. For example, the "CytoSoft 64 kPa" plates show a value of 21,333 on the graph (64,000 divided by 3).
(Thermal) means the hydrogel was only thermally gelled at 37C.
(XL) refers to amount of UV photocrosslinking time. This was performed on methacrylated (photocrosslinkable) hydrogels.
More details about the various products represented in this graph can be found in the following white papers:
Methacrylated ECM's for Photocrosslinkable Hydrogels
The gelation data (G’ shear modulus) was collected using the ElastoSens Bio2 contactless rheometer www.rheolution.com. Samples were gelled within the ElastoSens unit at 37°C for 30 minutes. Other testing methodologies use different measurements, sample volumes, pH, temperatures, gelation parameters, moduli, etc.. and may give different results than the values seen in the graphs above. Furthermore, gelation kinetics of collagen may slowly change over time. These values were obtained from fresh batches of each respective product.